The usability of 3Di as a flood calamity model
The need for a ‘flood calamity model’ for unforeseen scenarios and measures in case of imminent dike failure
Waterschap Rijn en IJssel is investing in up-to-date insight into the possible consequences of breaches of the river dikes. They are developing new flood models in D-Hydro for the five diked areas in their management area. These models are so-called policy models, which means that their purpose is to support policy decisions. For this reason, these models focus on simulation accuracy. An acceptable consequence of this choice is that calculation speed is secondary.
These policy models are used to create hundreds of flood images for all kinds of scenarios. For example, dozens of locations along the Rhine and IJssel rivers have been selected from which a potential dike breach is simulated. Multiple scenarios are then calculated for each breach location, for example with different river water levels. This creates a large archive of all kinds of potential flood scenarios. Based on this information, policy choices regarding dyke reinforcement, landscape design (e.g. housing locations) and the preparation of contingency plans, are made.
Yet it is impossible to be prepared for all situations. Firstly, because an infinity of combinations of factors is possible. Waterschap Rijn en IJssel manages almost 150 kilometres of primary flood defences, and on the vast majority of sections a breach is theoretically possible. In addition, there is much uncertainty about how and how fast a dike will breach. Also, for all these locations, many river water levels are possible. Besides the water level at which the dike would breach, the further course of the discharge wave is an important factor for the development of the flood image. Although not all factors directly cause a totally different flood picture, this does mean that an actual flood will always be somewhat different from the prepared scenarios.
Secondly, there is the action perspective in case of a (threatened) breach. For example, mobile flood defences are often used to slow or control the spread of water in the event of a dike breach. Another example are the, sometimes creative, measures that can be devised in a crisis situation. ‘Can we sail a ship into the breach to seal it?’ Then the need arises for ‘live’ calculations to understand the effect of such measures on limiting or slowing down the flood.
Since it is impossible to predict the exact threat situation and all possible measures at once, there is a need for an ‘ad hoc’ flood calamity model. With such a model, flood simulations can be carried out quickly. 3Di has been studied more often by independent experts, such as in the Benchmark Inundation Models (STOWA, 2017)2b. However, there is plenty of ongoing development of the software with both improvements and new features. This warrants a new study into the performance and functionalities of 3Di for this application.
The contingency model must be able to provide new flood information under time pressure. In practice, you can divide this into three phases: 1) translating the information needs into a model scenario and schematizing it in the software, 2) starting and running a simulation, 3) processing the results and distributing applicable information to the crisis organisation.
To understand the use of 3Di in these three phases, three research questions were drawn up:
- How easy is it to quickly configure a scenario?
- Is the calculation sufficiently fast without compromising accuracy?
- Is it possible to convert the results into information and share it quickly?
These research questions were answered in a case study for dike ring 49. Dike ring 49 ‘IJsselland’ is located east of the river IJssel and contains several inland cities, including Doetinchem and Doesburg. Its area is roughly 10 x 10 km.
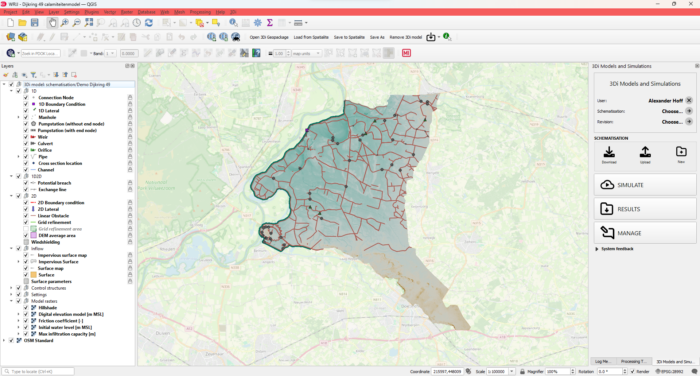
The 3Di calamity model of dike ring 49 opened in the 3Di Modeller Interface
Preparation: configuring a flood scenario
In the workflow of Waterschap Rijn en IJssel, a request for information is done with one of the hydrologists. They are the model experts who translate the information demand into the flood scenario, the so-called model schematization.
3Di offers an open source desktop application, the ‘3Di Modeller Interface’, for schematizing a flood scenario. This application is an adapted version of QGIS, the most widely used GIS software worldwide which is also open source. The idea behind this is that hydrodynamic modelling is usually already done in a GIS program, after which it is converted to the required model files. 3Di skips this step by letting the user create their model directly in the GIS environment.
When creating the calamity model for dike ring 49, modelling in GIS offered several advantages. The elevation model can be uploaded in raster format (GeoTiff). 3Di can handle the original resolution of the AHN: 0.5 x 0.5 m. Through the subgrid technology, detailed variations in elevation (and water courses) can be taken into account, despite the calculation grid being coarser (ranging from 20 to 80 metres).
Another practical application of GIS when creating the flood model is the specification of elevated line elements. As in D-Hydro, so-called ‘obstacle lines’ can be used in 3Di to explicitly indicate where elevated elements are situated in the landscape. This serves to increase the accuracy of the flood simulation without requiring additional computational cells (and thus computational time). These lines can be copied from other GIS files, such as road files and crest lines of embankments. The functionalities of the underlying QGIS make it easy to copy from source file to model.
In the application of calamity modelling for Waterschap Rijn en IJssel, it may be desirable to schematize emergency measures to visualize their effect. A practical example is to close underpasses or raise higher lying roads that lie outside a 5-kilometre radius of the breach. Such spatial model adaptations are easily realized with the standard GIS functionalities within the 3Di Modeller Interface.
The extensive possibilities offered by modelling in GIS also come with the disadvantage of complexity. Due to the many possibilities, it can sometimes be difficult to find functionalities. It therefore takes time for the modeller to become familiar with the software. The learning curve can be steep, although in this case study it proved no steeper than with other modelling software.
In some respects, schematization in 3Di is more explicit than in other model software. An example is the schematization of a weir. In 3Di, this consists of a connection between two calculation points (one in front of the weir, and one behind the weir). In other computational software, this is represented more simply in the form of a single point on the watercourse. The explicit schematization in 3Di has the advantage that the modeller has more control over the behaviour of the model in a flood situation. At the same time, explicit modelling has the consequence of making input more complex. This can make it challenging for the inexperienced modeller to choose the correct schematization, resulting in the risk of errors.
In the case study, it eventually emerged that the most desirable situation is to minimize the need to modify aspects of the model at the time of a disaster. This means that a ‘basic model’ should be on hand in which the necessary items, such as breach locations, are already included. In the event of a calamity, the only thing that needs to be done is to open the breach and add an outside water level. An experienced modeller can make these adjustments within minutes.
Computing: short calculation times with sufficient accuracy
In order to deploy the 3Di calamity model for Dike Ring 49 during a crisis situation, the requirement was set that the entire process of schematizing, calculating, and distributing flood information should take a maximum of 1 hour. This places high demands on the model’s calculation time. For the policy model this was not an issue; accuracy is paramount in that case. The calculation time of the policy model of dike ring 49 is as high as 2 to 4 hours (with 31 days of simulation time). For larger diked areas this can be several days.
It was expected that the 3Di calamity model would calculate faster than the policy model in D-HYDRO, mainly because of a more efficient calculation for 2D flow. 3Di uses a combination of two techniques: Subgrid and quadtrees3. This combination provides efficient 2D calculation with little loss of accuracy. The subgrid allows the computational cells to be chosen larger. This reduces the total number of computational cells and increases the computational speed. The underlying finer subgrid ensures that accuracy is largely maintained. At locations with a lot of variation in ground level elevations, it may be necessary to choose smaller computational cells. An example would be locations where the water system is located.
In the case study, it proved feasible to perform the computation time of a 9-day simulation well within the specified time of 1 hour. In doing so, however, it is important to make smart choices in the computational grid. Applying the necessary refinement of calculation cells at the right locations requires knowledge and experience of the modeller, with the subgrid-quadtree combination being somewhat more complex than the classic calculation cell with one fixed grid resolution and one ground level height per cell.
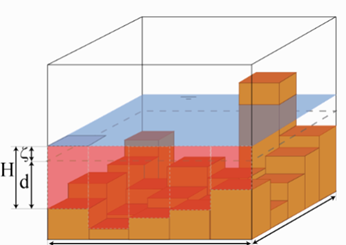
Schematic visualization of the subgrid technique within a computational cell
In the case study, not only the computational speed but also the accuracy of the calculation was examined. The basic principles are the same as in the policy models. The study found no indications that 3Di lacks accuracy on fundamental points. However, it is up to the modeller to make the right schematization choices to achieve reliable results.
For flood models, breach growth and breach flow rate have a significant influence on the results. The way 3Di calculates this is clearly described in the documentation and can be checked with an analytical (weir) formula. Incidentally, this study confirms the influence and sensitivity of breach growth schematization and calculation. For example, 3Di, D HYDRO and Tygron use the same breach growth formulation, namely the formula of Verheij van der Knaap4. The results are generally similar but can differ slightly. The cause is that 3Di addresses some points slightly differently, such as the use of subgrid in the calculation cell where the breach comes out. This means that the modeller must pay attention to this area in the flood calculations.
The resulting flood progression and final image from the 3Di calamity model for dike ring 49 is similar to the results of the D-HYDRO calamity model. The figure below shows the final images side by side. It should be noted that in the policy model the water system was additionally modelled in 1D. In the calamity model, the watercourses are part of the subgrid. This causes a slightly different distribution of water towards the hinterland. The other differences are mainly explained by the slightly different course and total volume of the breach flow.
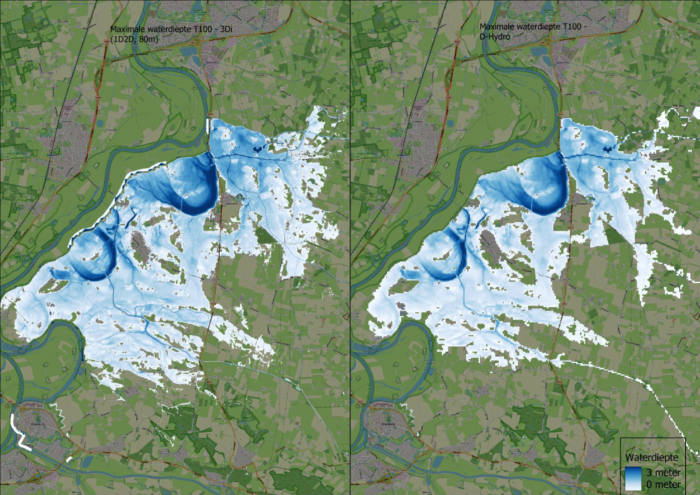
The left figure shows the final image of the 3Di calamity model and the right figure shows the final image of the policy model for reference
After calculation: generating and disseminating information
A major advantage of 3Di for ad hoc calamity modelling is that the course of the flood is already revealed during the calculation. With many other packages, interim results can be viewed during the simulation, but 3Di presents this immediately online on the 3Di Live website. This functionality was tested in a work session with the calamity model for Dike Ring 49. The modeller started the calculation, after which the participants could follow it. To do so, they could go to the 3Di Live website on their own laptop, log in and follow the calculation. This allows the modeller to analyze the system’s behaviour at an early stage and even to adjust the model in the meantime to include emergency measures. During crisis situations in which available time is limited, this can be of great added value.
The 3Di Live website also provides the ability to calculate ‘interactively’, which means that a calculation can be paused, after which adjustments can be made, and continued. In the work session, this functionality was used to test the effectiveness of temporary flood defences. After the modeller started the simulation, participants could follow the spreading of the floods on their own screens. After a short calculation period, the simulation was paused, and the group started discussing suitable locations for sandbags. These were diagrammed at the chosen location using the flood barrier function. This function allows the user to draw a line at the location of a barrier. The calculation can then be continued to simulate the effect of the sandbags on the spread of the water.
Once the flood simulation is complete, the results can be stored, post-processed and distributed. 3Di’s cloud environment provides various facilities for this purpose. For instance, all models are stored in a well-structured ‘models database’, in which they can be supplemented with metadata if necessary.
The model results can also be stored in 3Di’s cloud environment. For calamities, several functionalities are available that translate the flood images into other useful information products. The following maps were created for the calculated scenarios for Dike Ring 49:
- Maximum water depth
- Maximum flow velocity
- Arrival times
- Rate of rise
- Damage estimation
In the case study it was experienced that this automatic post-processing works well. After the calculation is done, the maps are produced automatically. The user is then notified as soon as they are ready.
Once the maps are ready, 3Di offers several options for distributing them within the crisis organization. Firstly, 3Di offers a web portal in which flood scenarios can be conveniently presented. Besides the static maps, users can also play an animation of the flood.
For advanced applications, the information products can also be linked through an API. A concrete application of this is to unlock maps directly in LCMS.
Conclusions
The aim of the study was to determine how suitable 3Di is as a flood calamity model for ‘ad hoc’ use in crisis situations. We saw that 3Di can be a specialist tool, but always produces traceable results. Its accuracy is not inferior to other instruments, with faster calculation times than the policy model. The automatic post-processing of calculation results and presentation of comprehensible map information (including flow velocity and arrival times) in the web portal offers a lot of added value for crisis organizations in which rapid imaging plays a major role.
References
- 3Di – Water Management (z.d.). https://3diwatermanagement.com/.
- Lieverse, T. (2023). Overstromingsstudie 3Di – Dijkring 49. https://edepot.wur.nl/641158
2b. Benchmark Inundatiemodellen (STOWA, 2017) - Stelling, G. (2012). Quadtree flood simulations with sub-grid digital elevation models.
- Verheij, H. (2003). Aanpassen van het bresgroeimodel binnen HIS-OM.
- Actuele Hoogtekaart Nederland (z.d.). https://www.ahn.nl/producten