Operational flood forecasting with 3Di
As a flood forecaster you are looking for a balance between speed and accuracy for your operational model. Most likely your model uses a 1D model or a 0D-1D combination for that reason. Unfortunately in such a model, reality is strongly simplified, in order to speed things up. In the calibration phase of such a model, assumptions are made about the water system and its forcings. There are all kind of work arounds, like post-processing 1D results on 2D terrain data but that always takes time and there is always uncertainty about the accuracy.
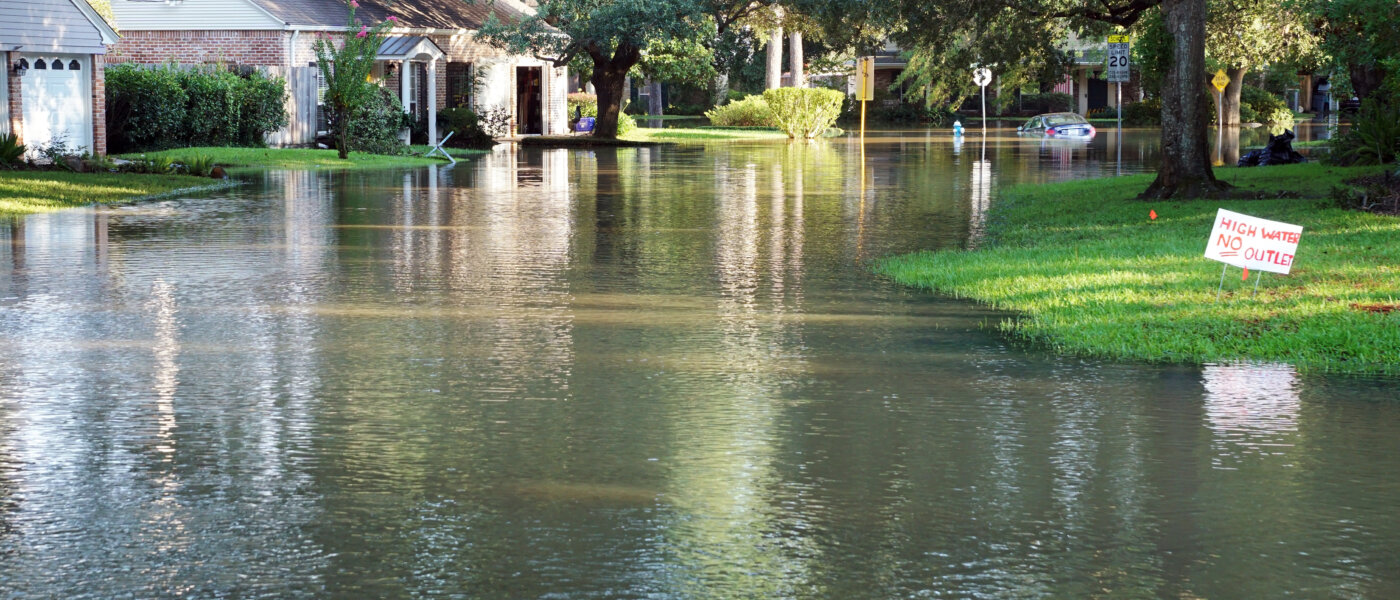
With 3Di it is now possible to make an operational model using the highest available detail. This includes hydrodynamically correct 2D simulations. This allow you to forecast the potential flood extent of rivers over time, before they occur.
HOW IS THAT POSSIBLE?
3Di is state of the art hydrodynamic water modeling software. It is applied in a wide range of applications. However, some key qualities of 3Di make it very favorable for operational flood forecasting. Any flood modeller knows:
- it is all about getting the best initial states, to provide the best possible start of your forecast simulation. The Integrated state-handler of 3Di allows the forecaster to set the initial state and or save states without the usage of third party software.
- it is about accuracy in relation to speed. Thanks to its subgrid method it is possible to use the highest available data, with a limited effect on the computational time, even when simulating large areas.
- it is about getting the crucial details right. 3Di offers a fully integrated coupling with 1D elements. This allows you to take the effects of weir and culverts into account. In case you want to go all the way, you can also take a full sewage system into account.
- it is about getting the dry area right. The prediction of a flood, is also about predicting the safe and the dry areas. In flooding applications it is crucial to get the computation of flooding and drying right. Thanks to the subgrid technique, this is never a problem.
A REAL WORLD EXAMPLE
A real world example of these qualities are displayed in the region of Parramatta council (Sydney, Australia). In the Parramatta region, it can be dry for weeks. In these periods, large areas of the river dry up. The weather can suddenly change with massive amounts of rainfall. This can result in a flash flood in the highly urbanized areas. To be able to act, before the flood starts, together with Royal Haskoning DHV we have set up a operational flood forecasting system (FLASH). This model is forced by previous model outcomes and by rain forecasts provided by the National Weather institute (Bureau of Meteorology).
A fully 2D model is made of an area of 114 km². The crucial weirs, culverts and obstacles are integrated using 1D elements. The computational time of a sixteen hours scenario varies roughly between 9 and 18 minutes, depending on the amount of rain. The water level and depth results are returned on a 1 m² spatial- and 10 minutes temporal resolution. Containing among other things, velocity, waterlevel/waterdepth and input variables such as the intensity of rain are forced onto the model.
STATISTICS
This year the model has run a total of 14.872 operational runs. Running that frequent, even when there is no rain predicted, provides a state that over time synchronizes seamlessly with the real world. There is no real need for forcing measurement data with the exception of rainfall onto the model. The setup is therefore easy and independent on valid measurement data. This year the forecast simulation failed 34 times (0.2 % of total runs) with only a handful due to an unstable scenario.
This being said, let’s look at the results, they speak for themselves:

Water level map of the 2D results of the area near Marsden Weir, the downstream boundary of the Parramatta river.

Precipitation (bar chart) and water level (line chart) for a training location in the parramatta catchment. The left hand side of the graph represents history, the right hand side is a prediction of water level based on the weather forecast. The horizontal lines represent warning levels for this location.